Content syndication has evolved from a lead generation tactic into a measurable demand engine. As investment increases, leadership expectations also change. CMOs and RevOps leaders no longer want activity reports, they want clarity on performance, pipeline contribution, and revenue influence.
A well-structured content syndication reporting dashboard bridges this gap. It transforms campaign data into actionable insight, helping organizations understand not just how many leads were generated, but how those leads progressed through the funnel and contributed to revenue outcomes.
This guide explains how to build a content syndication reporting dashboard that focuses on metrics that matter, aligns marketing with revenue goals, and enables better decision-making across teams.
The Role of a Content Syndication Dashboard
A content syndication reporting dashboard serves as a single source of truth for campaign performance. Instead of fragmented reports across vendors, marketing automation platforms, and CRM systems, the dashboard consolidates performance views into a structured framework.
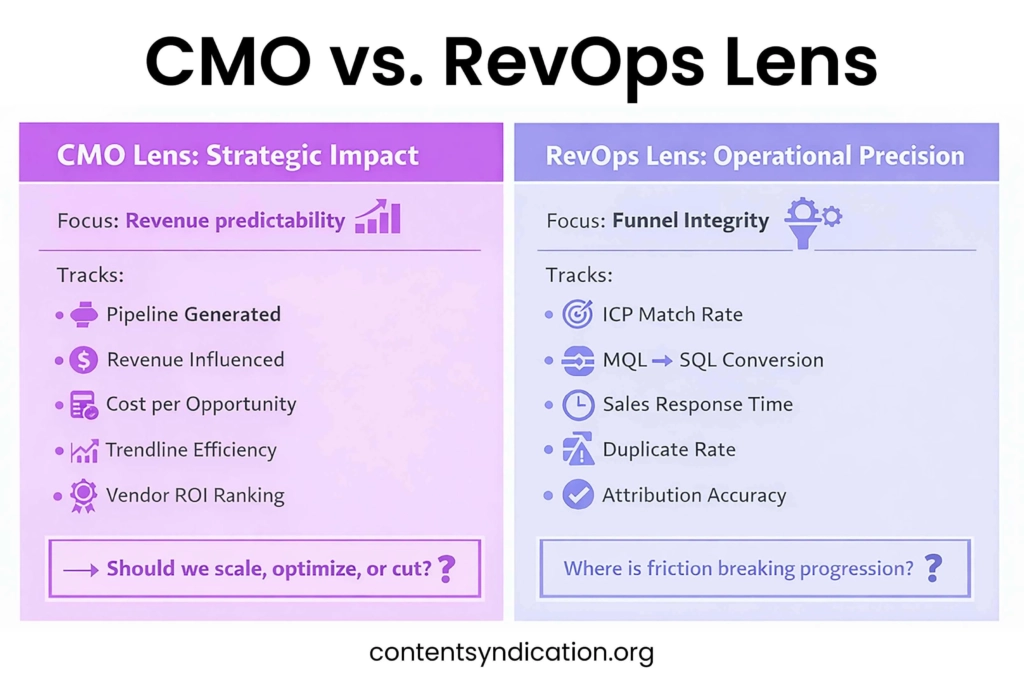
The goal of content syndication performance reporting is not to track activity alone. It is to answer strategic questions:
- Are we reaching the right accounts and personas?
- Are leads progressing through the funnel?
- Which vendors and assets drive pipeline impact?
- Where is conversion friction occurring?
For RevOps teams, this dashboard creates alignment between marketing execution and sales outcomes. For CMOs, it provides visibility into ROI and future investment decisions.
Top-of-Funnel Metrics That Actually Matter
Top-of-funnel measurement often stops at volume. Strong content syndication KPIs go further by measuring efficiency and targeting accuracy.
Lead Volume by Campaign and Vendor
This shows output, but volume alone is not success. In a content syndication reporting dashboard, volume must be segmented by source to reveal which partners consistently generate scalable reach.
Cost Alignment against Cost Per Lead (CPL) benchmarks (internal)
Calculation: CPL = Total campaign spend ÷ Total leads generated
Comparing campaign CPL against historical internal benchmarks reveals whether efficiency is improving or deteriorating. A rising CPL with declining conversion indicates targeting or messaging issues.
Persona and ICP Match Rate
Calculation: (Leads matching ICP ÷ Total leads) × 100
This measures how many leads match defined roles, industries, and company sizes. A high mismatch rate signals poor audience targeting, which will later impact conversion performance.
Early Funnel Qualification Signals
Speed of form completion, completeness of data, and email validity provide early indicators of seriousness. Including these in a content syndication reporting dashboard prevents low-quality data from distorting mid-funnel insights.
At this stage, the goal of the content syndication reporting dashboard is to confirm that reach equals relevance, not just activity.
Mid-Funnel Quality & Conversion Metrics
The mid-funnel reveals whether leads are progressing or stalling. This is where content syndication funnel metrics, MQL, SQL, and opportunity tracking become critical.
Lead-to-MQL Rate
Calculation: (Number of MQLs ÷ Total leads) × 100
This metric shows the percentage of raw leads that meet marketing qualification criteria. A low rate may indicate weak targeting. A high rate suggests strong audience alignment.
MQL-to-SQL Rate
Calculation: (SQLs ÷ MQLs) × 100
This measures how many marketing-qualified leads are accepted and progressed by sales. If MQL-to-SQL conversion is weak, misalignment between scoring logic and real buying intent may exist.
Sales Acceptance and Response Time
Fast follow-up correlates strongly with progression. Including time-to-contact in the content syndication reporting dashboard helps identify operational friction rather than campaign failure.
These metrics directly address a frequent leadership question: how to track lead quality from content syndication. Instead of relying on anecdotal feedback, qualification progression becomes the proof point.
Pipeline & Revenue Metrics
Pipeline contribution separates high-performing programs from vanity campaigns. True content syndication pipeline metrics evaluate movement beyond qualification.
SQL-to-Opportunity Rate
This measures how often sales-qualified leads convert into real opportunities. A strong rate signals buying intent. A weak rate may indicate premature qualification.
Opportunity Creation by Source
Calculation: (Opportunities from Vendor A ÷ Total leads from Vendor A) × 100
Tracking which vendor or campaign produces the most opportunities allows budget reallocation toward higher-yield sources.
Opportunity Win Rate by Source
Calculation: (Closed-won deals from source ÷ Total opportunities from source) × 100
This metric evaluates downstream performance. Some channels may generate fewer opportunities but produce higher close rates, indicating stronger buying intent.
Revenue Efficiency Indicators
Cost per SQL
Calculation: Total spend ÷ Total SQLs
Cost per Opportunity
Calculation: Total spend ÷ Total opportunities created
Customer Acquisition Cost
Calculation: Total spend on syndication ÷ Revenue generated from syndication-sourced closed-won deals
The metric influence enables revenue-based efficiency comparisons across channels.
These insights help answer the strategic comparison of content syndication CPL vs cost per opportunity. Lead cost alone rarely reflects true efficiency; opportunity cost provides a clearer financial signal.
When surfaced within a content syndication reporting dashboard, these metrics allow leadership to view syndication as a predictable revenue contributor rather than a top-of-funnel experiment.
Account-Level & ABM Metrics
Modern B2B buying involves multiple stakeholders. Individual lead reporting is no longer sufficient. Incorporating RevOps metrics for content syndication at the account level provides broader visibility.
Account Penetration Rate
Measures how many target accounts have at least one engaged contact from syndication efforts.
Multi-Contact Engagement
Tracks whether multiple roles within the same organization have entered the funnel, a strong indicator of deal viability.
Account Progression Across Stages
Shows how many accounts move from initial contact to qualified opportunity.
When embedded into a content syndication reporting dashboard, these metrics reveal whether campaigns influence buying groups rather than isolated individuals.
Vendor & Asset Performance Views
Not all vendors deliver equal value. Without structured vendor-level analysis, inefficient spending can continue to go unnoticed.
The content syndication reporting dashboard should compare:
- Conversion performance by vendor
- Opportunity yield by asset type
- Funnel velocity differences across sources
This enables teams to identify the best KPIs for evaluating content syndication vendors based on downstream impact rather than just cost.
Asset-level visibility also reveals which formats drive stronger engagement. For example, high-intent guides may convert faster than broad awareness content.
Data Hygiene & Accuracy Checks
Even the best dashboard fails without clean data.
A mature content syndication reporting dashboard includes validation safeguards:
Duplicate Monitoring
Ensures the same contact is not counted multiple times across campaigns.
Attribution Consistency
Validates that opportunities are correctly tied to original sources.
Field Standardization
Prevents inconsistent role titles or industry classifications from distorting reporting.
Data accuracy protects credibility. For RevOps, precision is not optional; it is foundational.
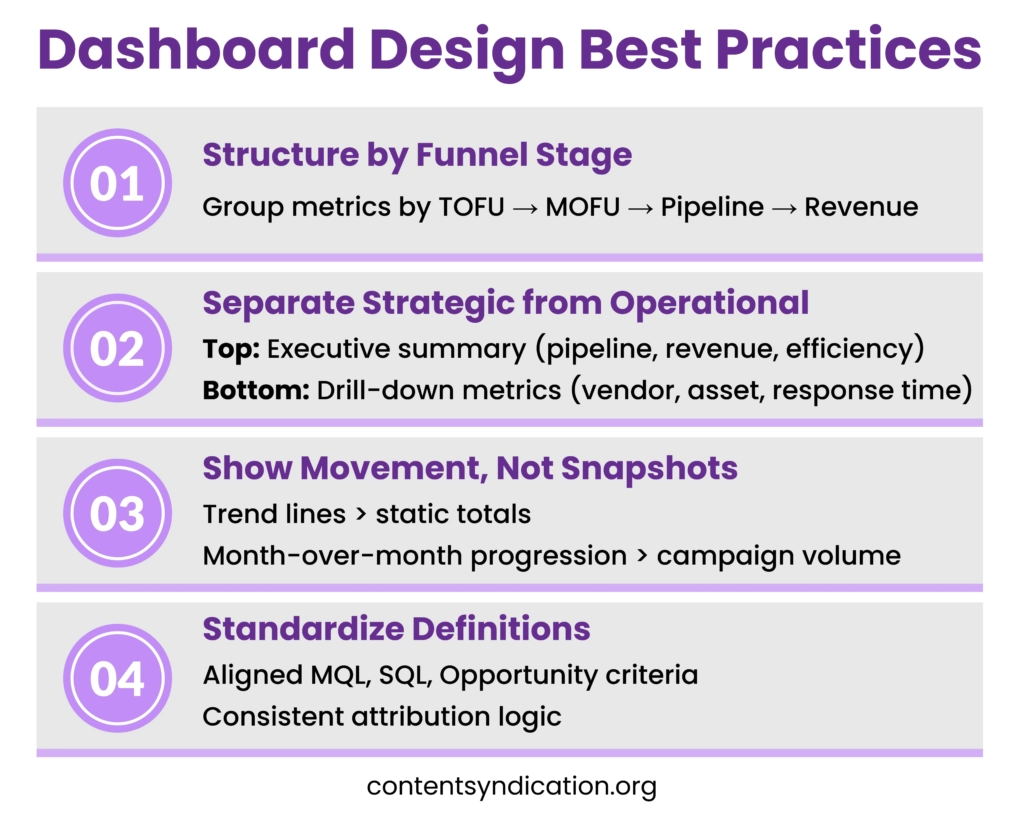
Dashboard Design Best Practices
Design determines usability. Overloaded dashboards create confusion rather than clarity.
When deciding what metrics I should track for content syndication campaigns, prioritize progression and revenue alignment.
Understanding how to report content syndication performance to CMOs means simplifying complexity. Executives want directional insight, not operational noise.
Dashboard Blueprint
A structured content syndication dashboard template for RevOps typically includes three layers inside the content syndication reporting dashboard:
Executive Layer
Pipeline generated, opportunity value, revenue influence, and efficiency trends.
Funnel Layer
Lead acquisition, qualification progression, and conversion rates across stages.
Optimization Layer
Vendor comparisons, asset effectiveness, and quality validation metrics.
This layered design ensures the content syndication reporting dashboard serves both strategic oversight and tactical improvement.
When properly implemented, a content syndication reporting dashboard becomes more than a reporting tool. It becomes a growth control center, aligning marketing investment with measurable revenue impact and enabling confident scaling decisions.
Conclusion
Effective content syndication is evaluated by measurable progress toward revenue outcomes. When metrics are clearly defined and consistently calculated, teams move beyond activity tracking to performance improvement, ensuring every campaign contributes to pipeline momentum, stronger engagement, and predictable growth aligned with business objectives.